

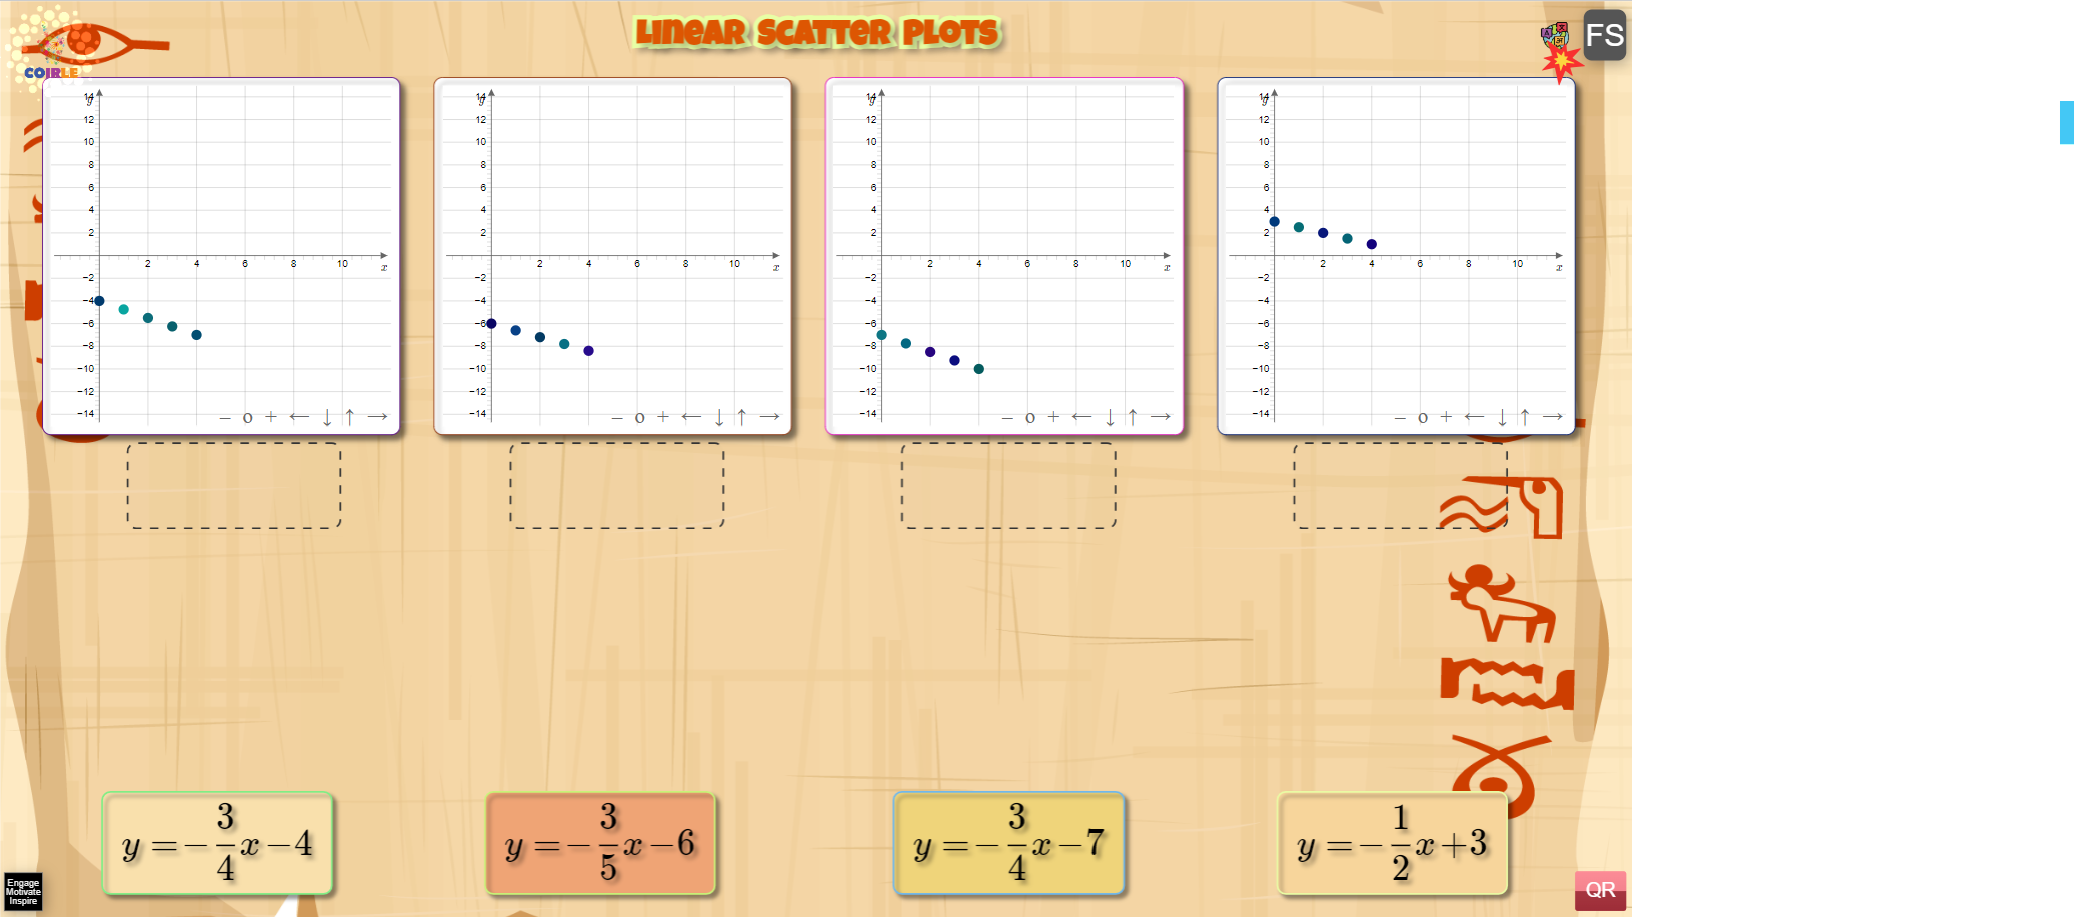

Students explore linear relationships in data by matching scatter plots to their corresponding trend line equations. Learners analyze the pattern of points to determine slope and identify the best-fitting linear model. This activity supports TEKS 5.4.C (represent relationships using tables and graphs) and aligns with Common Core 8.SP.A.2.
Skills: data analysis, scatter plots, linear relationships, graphing. Grades 5-8.